What is the Parabolic SAR?
The Parabolic SAR indicator is an effective indicator that is used to determine trend reversal points and set stop orders.
The stock trader J. Welles Wilder Jr., already known to everyone today, developed Parabolic SAR in 1976 to search for market reversal points on the chart. Wilder is the author of several useful books on trading theory and the author of other equally popular indicators – RSI and DMI. All its tools, as basic, are often used in different trading strategies. The full name of the indicator is Parabolic Stop and Reverse.
The prefix "Parabolic" appeared due to the fact that the outlines of the indicator on the chart resemble a parabola. At the moment of the expected trend change, the PSAR markers move to the other side of the chart, that is, they indicate a reversal, hence the "Stop and Reverse".
Its use allows you to predict with maximum accuracy the state of the market preceding a sharp change in trend (reversal). Parabolic SAR continues to be one of the most reliable tools for technical analysis and trading in the 21st century.
How does it work?
The purpose of Wilder's search was a system that would allow you to get maximum profit from trend movements. The resulting Parabolic indicator allows you to calculate both the beginning of a new trend and its completion. At the same time, PSAR does not try to guess the peak of the movement, but follows the trend, making it possible to maximize profits, gradually shifting the level of fixing losses.
Here are the basic principles of Wilder's parabolic SAR strategy:
- SAR points below the current market price indicate an uptrend;
- SAR points above the market price indicate a downtrend;
- Open a position when the price breaks through the SAR - buy if the price crosses over the SAR, and sell if the price crosses below the SAR;
- You stop and make a reversal of your position when the price crosses the SAR again.
You can improve your strategy of working with the Parabolic SAR indicator by using other indicators as auxiliary tools when making decisions.
Formulas for calculating Parabolic SAR
The Parabolic SAR formula shows that it differs from a typical indicator. Most indicators have a mathematical formula by which its value is calculated. Parabolic SAR (PSAR), in addition to the mathematical part, also has a logical one (depends on the direction of the trend).
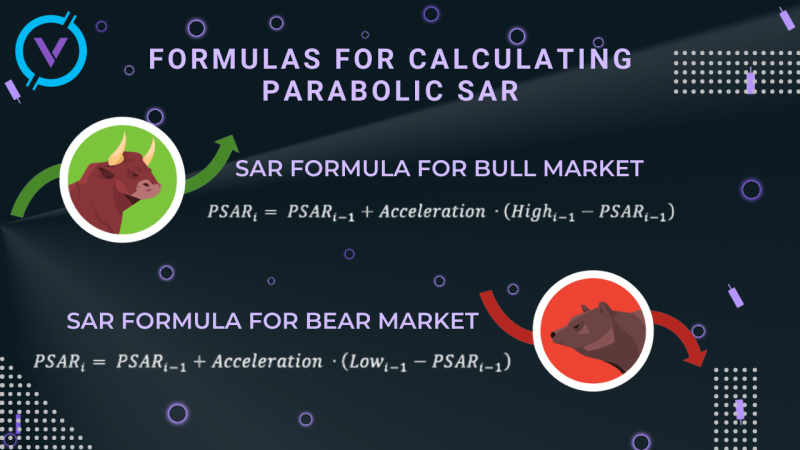
The following designations are used in these dependencies:
- PSARi, PSARi-1 – the indicator value on the current and previous candles, respectively.
- Acceleration is an acceleration factor, it and its impact will be discussed below.
- Highi-1, Lowi-1 – respectively the maximum and minimum on the previous candle.
Since the indicator shows itself well in the trending market, the main task of this indicator is to determine the direction of the main trend and the moment for closing open transactions at the moments of trend reversal, that is, the analysis of trending markets.
Advantages
- The main advantage of Parabolic SAR is the ability to catch a trend movement at its very beginning:
If the trend hasn’t formed, the indicator promptly switches to another price, demonstrating a reversal or stop. Thus, in its work, the indicator reacts to changes in time, and not only to changes in price and on time, determines the trend reversal with high accuracy.
- If the price chart is located above the indicator curve, this indicates an uptrend:
If the price is under the curve of the indicator, it is a downtrend.
- The indicator finds the most profitable entry/exit points from the market:
Traders use the indicator reversal for technical analysis. So, if you observe a reversal of the Parabolic SAR, this indicates the end of the trend.
Disadvantages of the indicator
- It cannot be called a "universal" tool for all types of trends:
In the fleet, its signals are not sufficiently convincing and clear to determine the direction of the trend and open trading positions.
- As a rule, the indicator works on large timeframes:
And this is not always convenient for a trader.
- According to its essence, Parabolic SAR assumes a trend change when the indicator reaches a stop:
But in fact, it is very often possible to observe the subsequent continuation of the trend. Thus, with a strong trend, the Parabolic SAR System often shows false moments to exit the market.
Conclusion
Parabolic SAR is a valuable trading tool. It is understandable even for novice traders. The indicator is clear and has no neutral values. Wilder has been using it for decades, successfully trading on the basis of Parabolic and other indicators. In the trading community, this indicator remains popular even decades after its invention – this is the best proof of its effectiveness.