Indicators are algorithms designed to simplify market analysis. They are used in all markets and exchanges, including cryptocurrency.
Technical analysis indicators are divided into leading and lagging. The first form signals about a possible trend. The latter help to identify an existing trend. The first indicators include RSI and stochastic RSI, the second moving averages, MACD and Bollinger lines.
The VWAP indicator is a great alternative to moving averages. Moving averages are the simplest and most popular indicator, which is one of the basic tools of each trading platform. Dozens of the same basic and combined indicators are built on their basis.
For example, earlier we published an article about Bollinger Bands. These are, in fact, the same moving averages with a standard deviation in the formula, located on both sides of the price and forming a channel. And yet, like any other indicators, moving indicators are not without drawbacks: they calculate the average price at the prices of individual timeframes, but do not take into account trading volumes within them. Attempts to improve the basic tool have led to the emergence of exponential sliding, EMA, WMA and other varieties of this tool.
Now, in more detail about the VWAP!
What is the VWAP?
The Weighted Average price by volume or VWAP is a technical indicator used by traders to detect support and resistance levels, manage inputs/ outputs from transactions, determine the direction of the market, measure trend strength and much more.
VWAP does not predict price movements, it shows the current situation. With this indicator, traders can easily visually assess who is in control of the situation – buyers or sellers – and move with them, not against them.
The indicator itself is quite simple: it is displayed as a line on the chart, and when the price is above this line, it means that the asset is on an uptrend, and when the price is below the line, it means that the asset is most likely in a downtrend.
- VWAP was first used in 1984 by the chief trader of the analytical firm Abel Noser.
- The tool became more popular in the 1990s, when traders discovered that trading using the VWAP indicator strategy is relatively safe: it is impossible to win big with it, but it can help avoid unpleasant losses.
How to calculate VWAP?
- Let's start with Price: the value of the average price for calculating VWAP can be based on a different set of data. Some versions of the indicator provide for changing the type of price. For example, using only the average closing prices of the market, minimum and maximum; or the average value of the opening and closing prices of the market, the highest and lowest prices for the day.
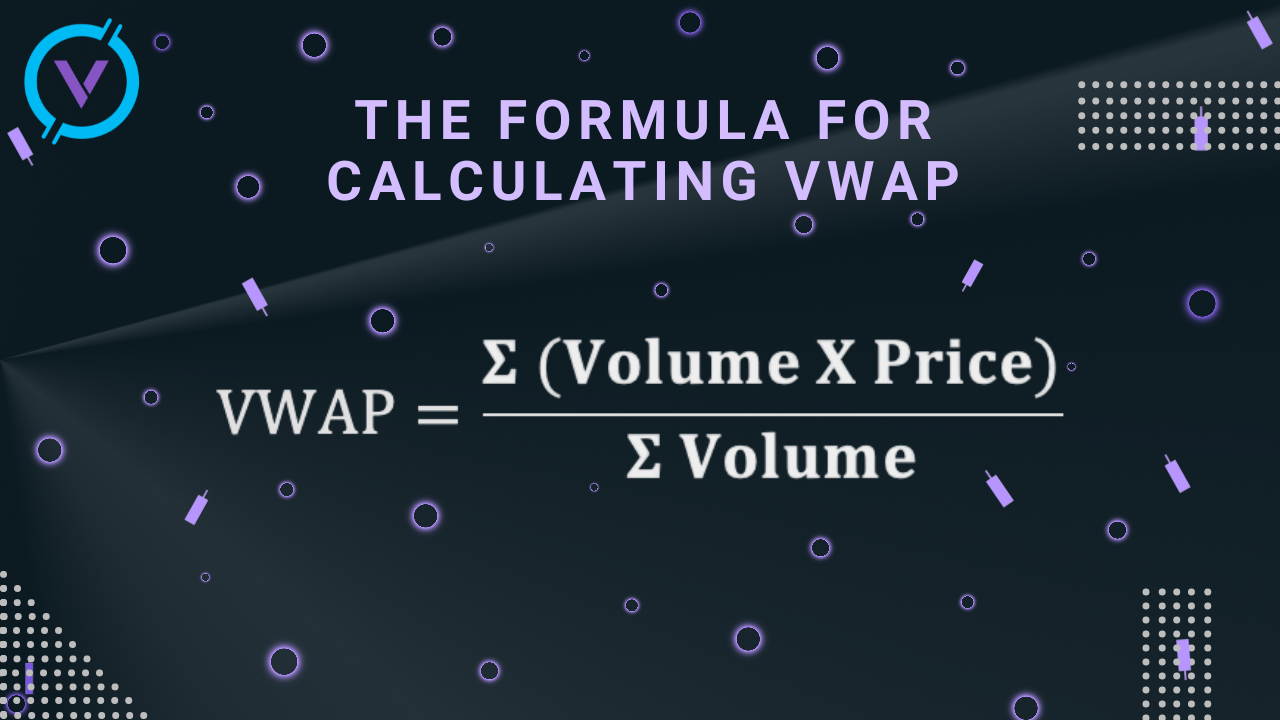
- According to the formula, the obtained value of the average price is multiplied by the volume.
- The numerator is calculated: the cumulative indicator of the product of the value of the average price per volume for the entire period . The whole period means the number of candles specified in the indicator settings.
- The denominator is calculated: the total volume for the entire period.
- The ratio of the numerator to the denominator is calculated.
The weighted average price is calculated for the specified period. The calculation can be carried out for different timeframes. The indicator calculates data from the beginning of the period specified in the settings (for example, hour, day, week) to the end point in cumulative mode.
The data is not averaged. It is also important to set the correct time in the indicator settings, which corresponds to the time of your broker. Also, the trader needs to specify the desired number of periods that should be taken into account when calculating VWAP. The results will be presented on the asset chart in the form of a line.
The indicator does not indicate individual large positions in one direction or another. It displays the price level with a relatively large or, conversely, low volume level, which is a sign of high or low liquidity.
What the VWAP tells traders
Compared to the traditional moving average, VWAP determines the "true" average price based on the volume of transactions at each price level.
Despite the fact that the VWAP indicator is a useful tool for short–term and one-day trading, it is far from perfect, especially when it comes to long-term work.
If you try to calculate VWAP too often for several days, it can distort the data, and as a result you will see unreliable indicators.
There are also questions about its usefulness during strong long-term trends: if the rise lasts for a long time, you may not notice how the price will fall below the VWAP indicator, and miss trading opportunities.
Finally, the VWAP indicator tells only part of the asset price history. If you want to use a trading strategy with the VWAP indicator, it is better to consider it in combination with other analytical tools to get a more detailed picture of the market condition.
VWAP limitations
The classic VWAP is calculated within one day, cumulative total, every minute. VWAP has no predictive properties, it states what has happened and will start (start counting) from the opening prices and volumes at the beginning of the day.
The essence of the restrictions can be formulated as follows:
- It cannot be used for trend forecasting. He is not looking for patterns in previous periods.
- It is better to use at short and medium intervals: M5-H1.
- This is a trend indicator for markets with average volatility. At the time of the news release, it is better not to open deals on it.
Conclusions
VWAP is a useful signal confirmation tool, which in its essence and methods of application is very similar to sliding. But unlike them, it provides more reliable data on market volumes and the average market price.
It complements trend indicators and oscillators quite well and is more sensitive to price/volume changes than moving ones. He will be an excellent assistant when making decisions about entering or exiting the market.